
Key takeaways
- OEE software captures production, stops with reasons and counts, and shows where the time went by equipment, line and plant.
- In MaintWiz the OEE dashboard shows loss stratification, daily OEE and a lost-hours Pareto for each equipment.
- The roll-up from equipment to line to plant adds times; it does not average percentages.
- Stops, counts and ideal rates are captured once and used by OEE, the loss Pareto and the downtime report.
What it does
What does MaintWiz OEE software do?
MaintWiz OEE software records every stop with its reason, the total and good counts and the planned time for each equipment, and shows OEE by equipment, line and plant on the same equipment list as work orders. Of the four types of OEE software, it is the CMMS-based one, so each loss and the work order that removes it share one equipment record.
Downloads
OEE starter files: calculator, shift sheet and downtime cost
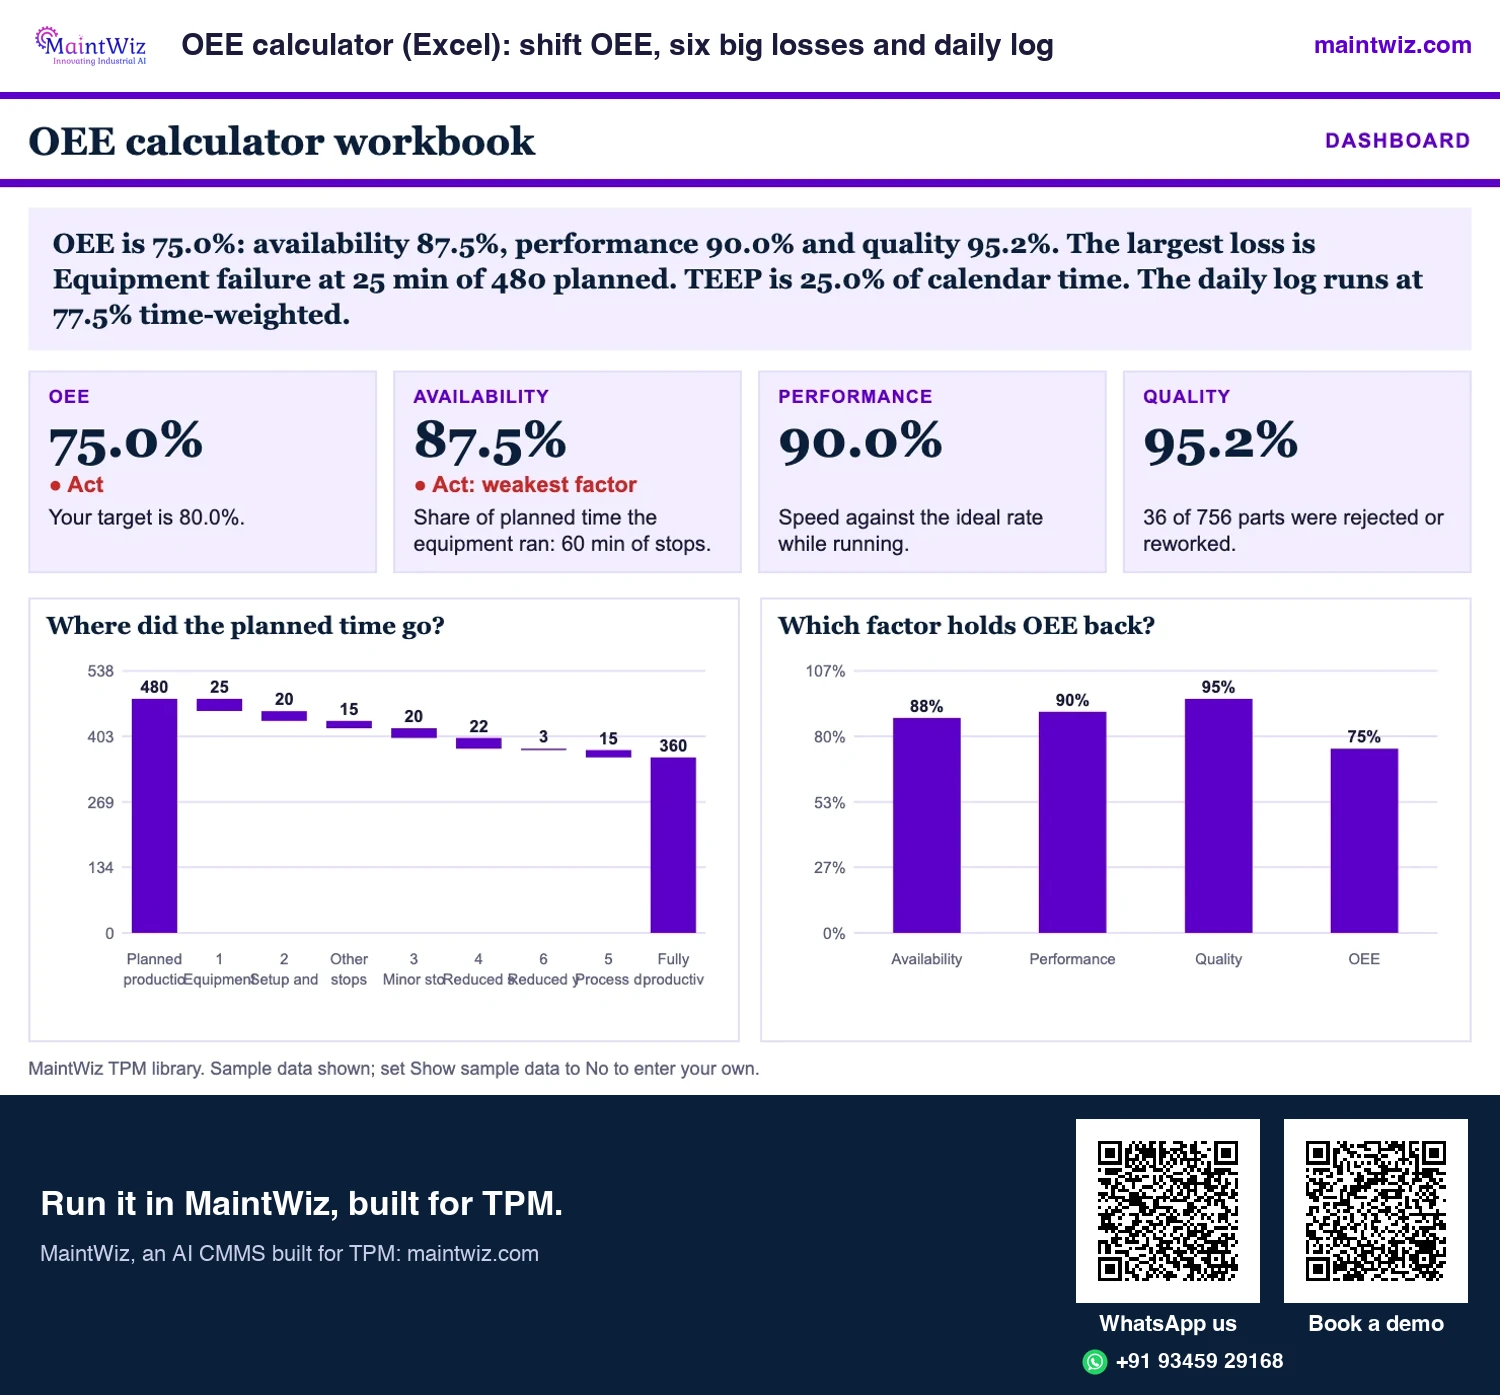
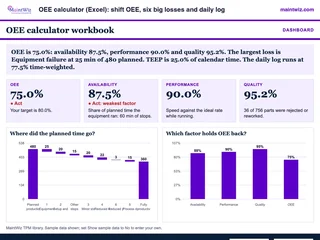 ExcelOEE calculator (Excel): shift OEE, six big losses and daily log
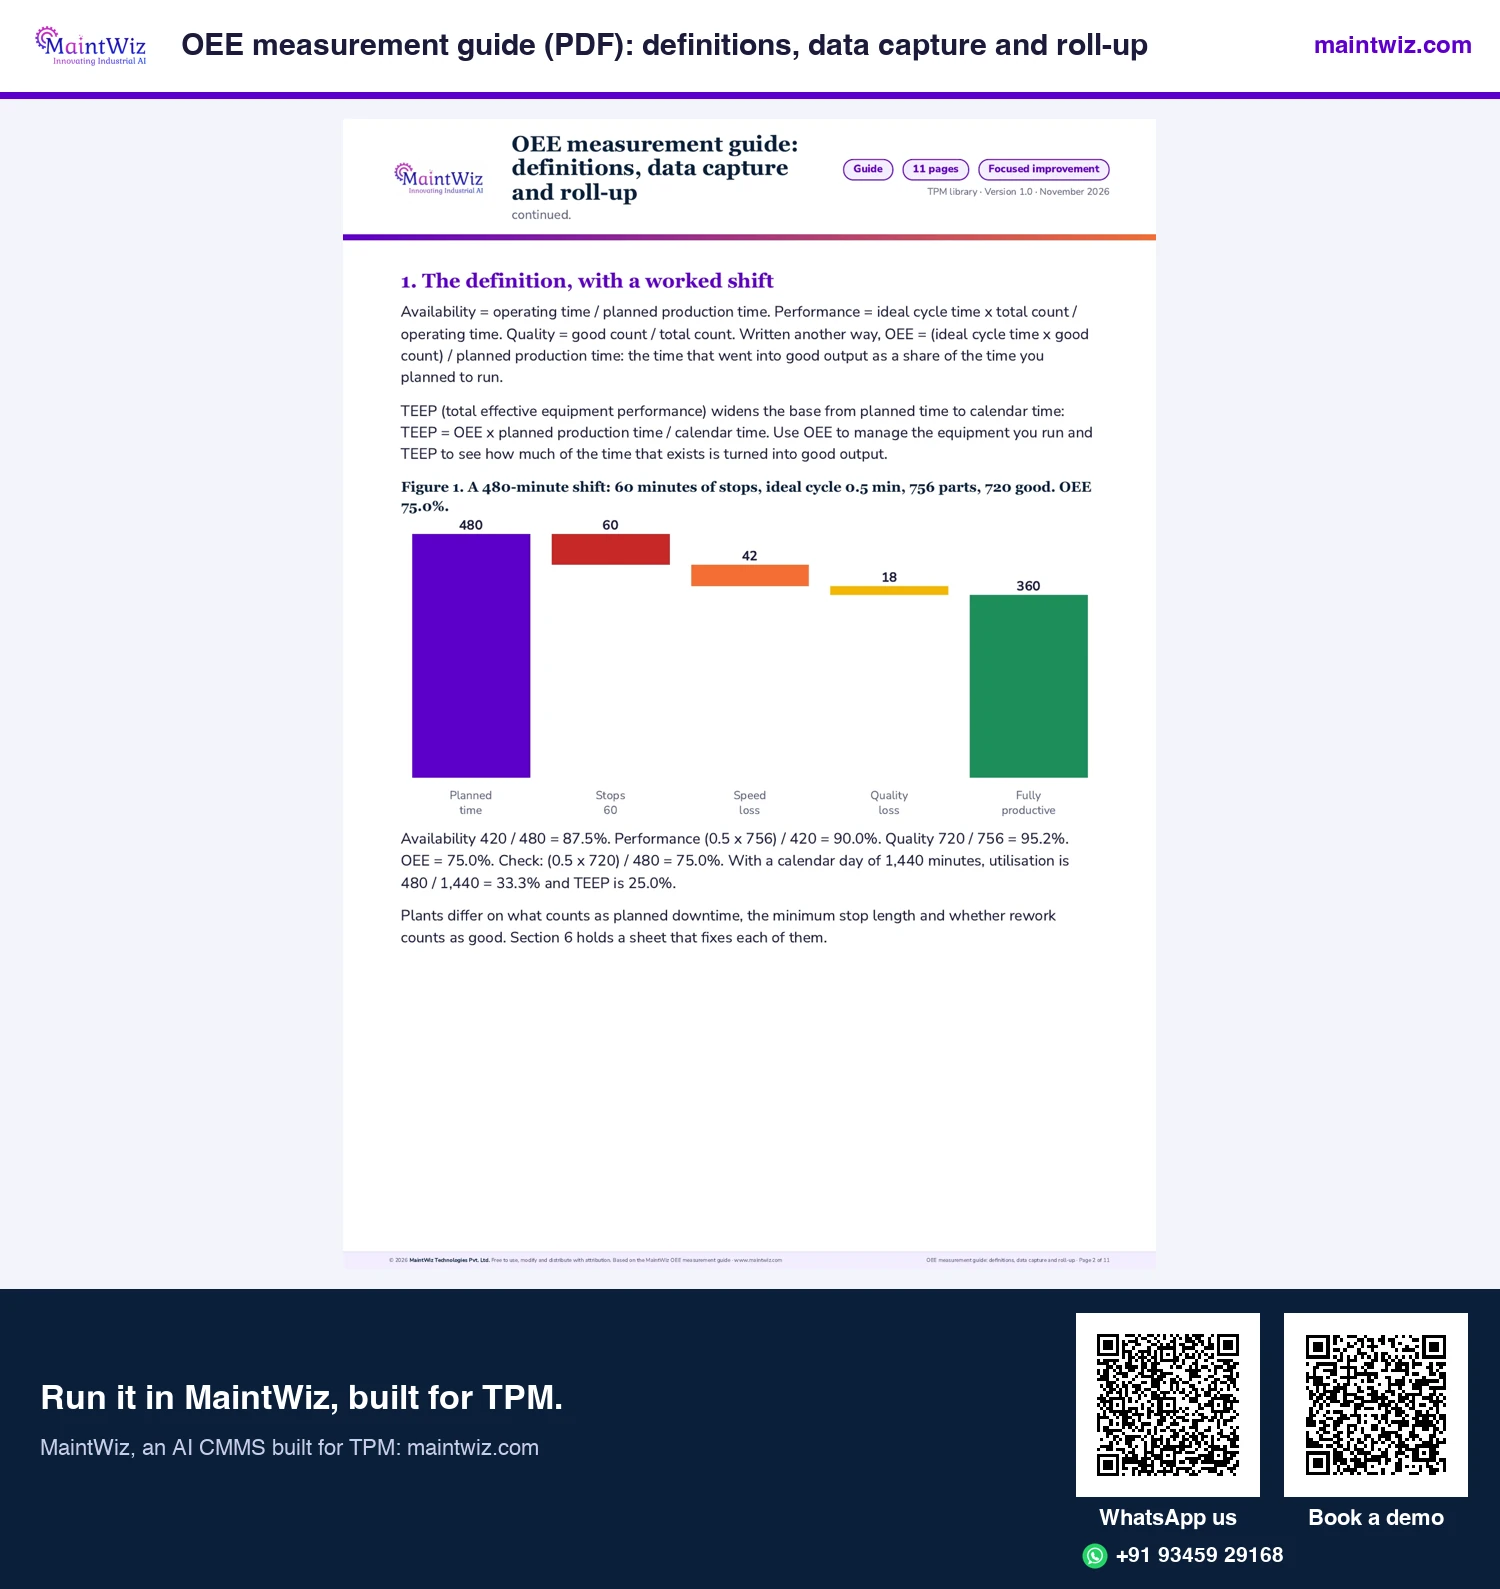
Type one shift and see OEE, the three factors and where every planned minute went
- Sheets
- Dashboard, Shift calculator, Daily log, 480 min shift, Two products in one shift, Read me
- A4
- Version
- v1.1, 5 November 2026
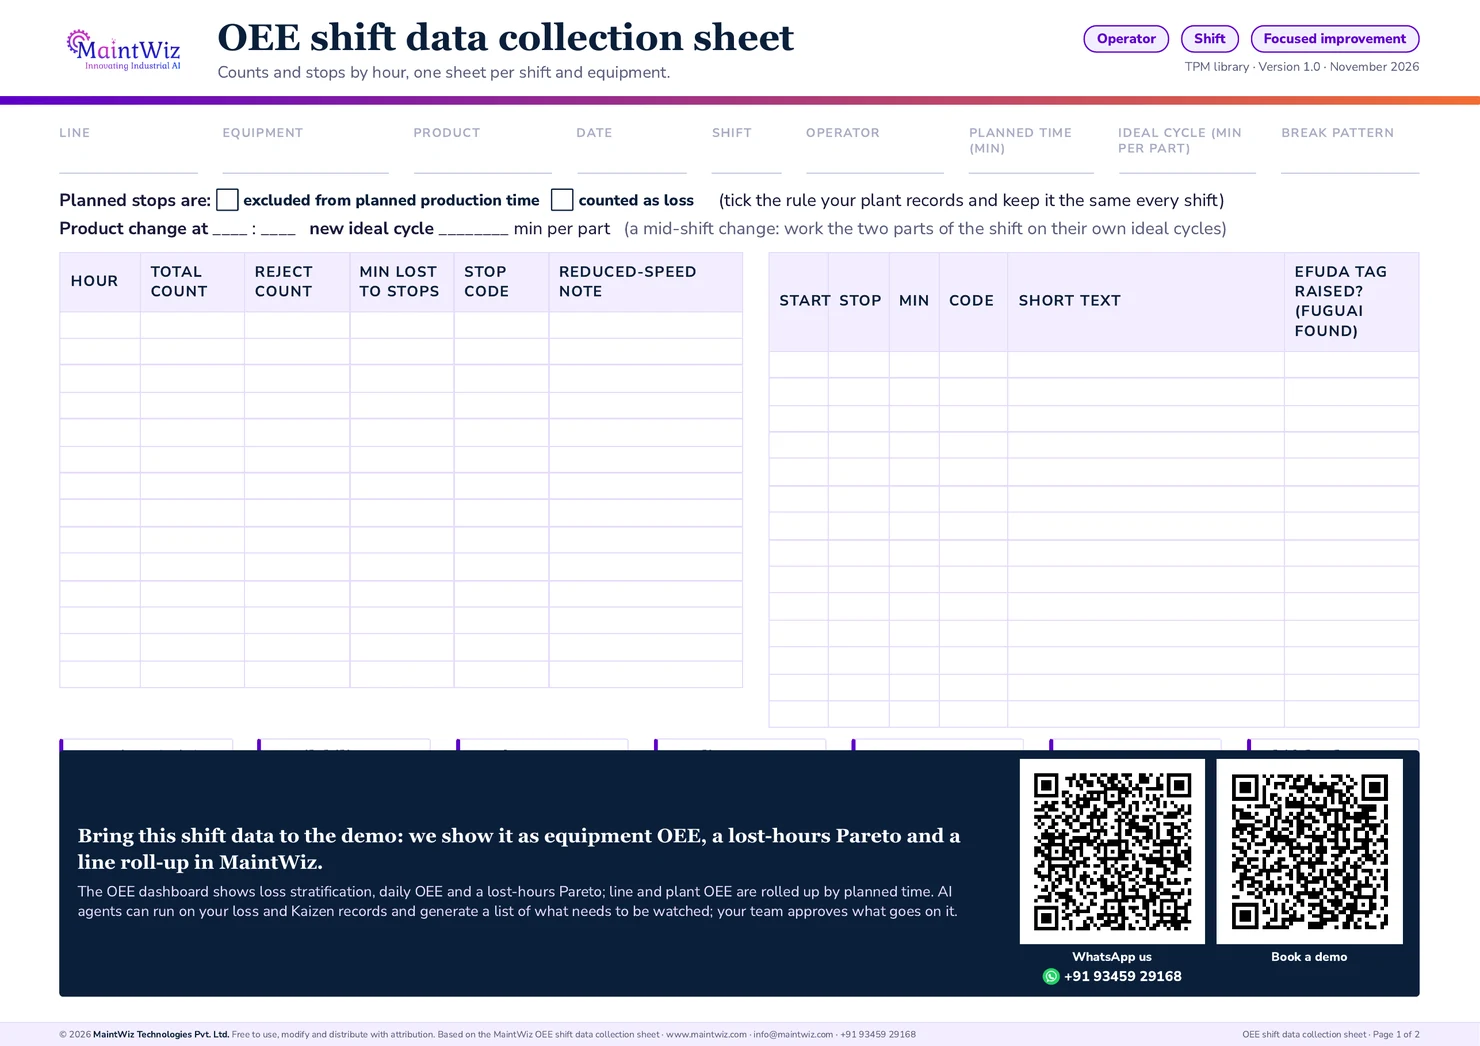
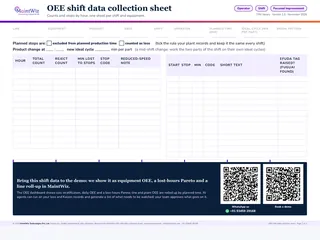 PDFOEE shift data collection sheet
Print one sheet per shift and equipment: hourly counts, a coded stop log, efuda tag column and a product change line
- Pages
- 2
- A4 landscape
- Created
- 5 November 2026
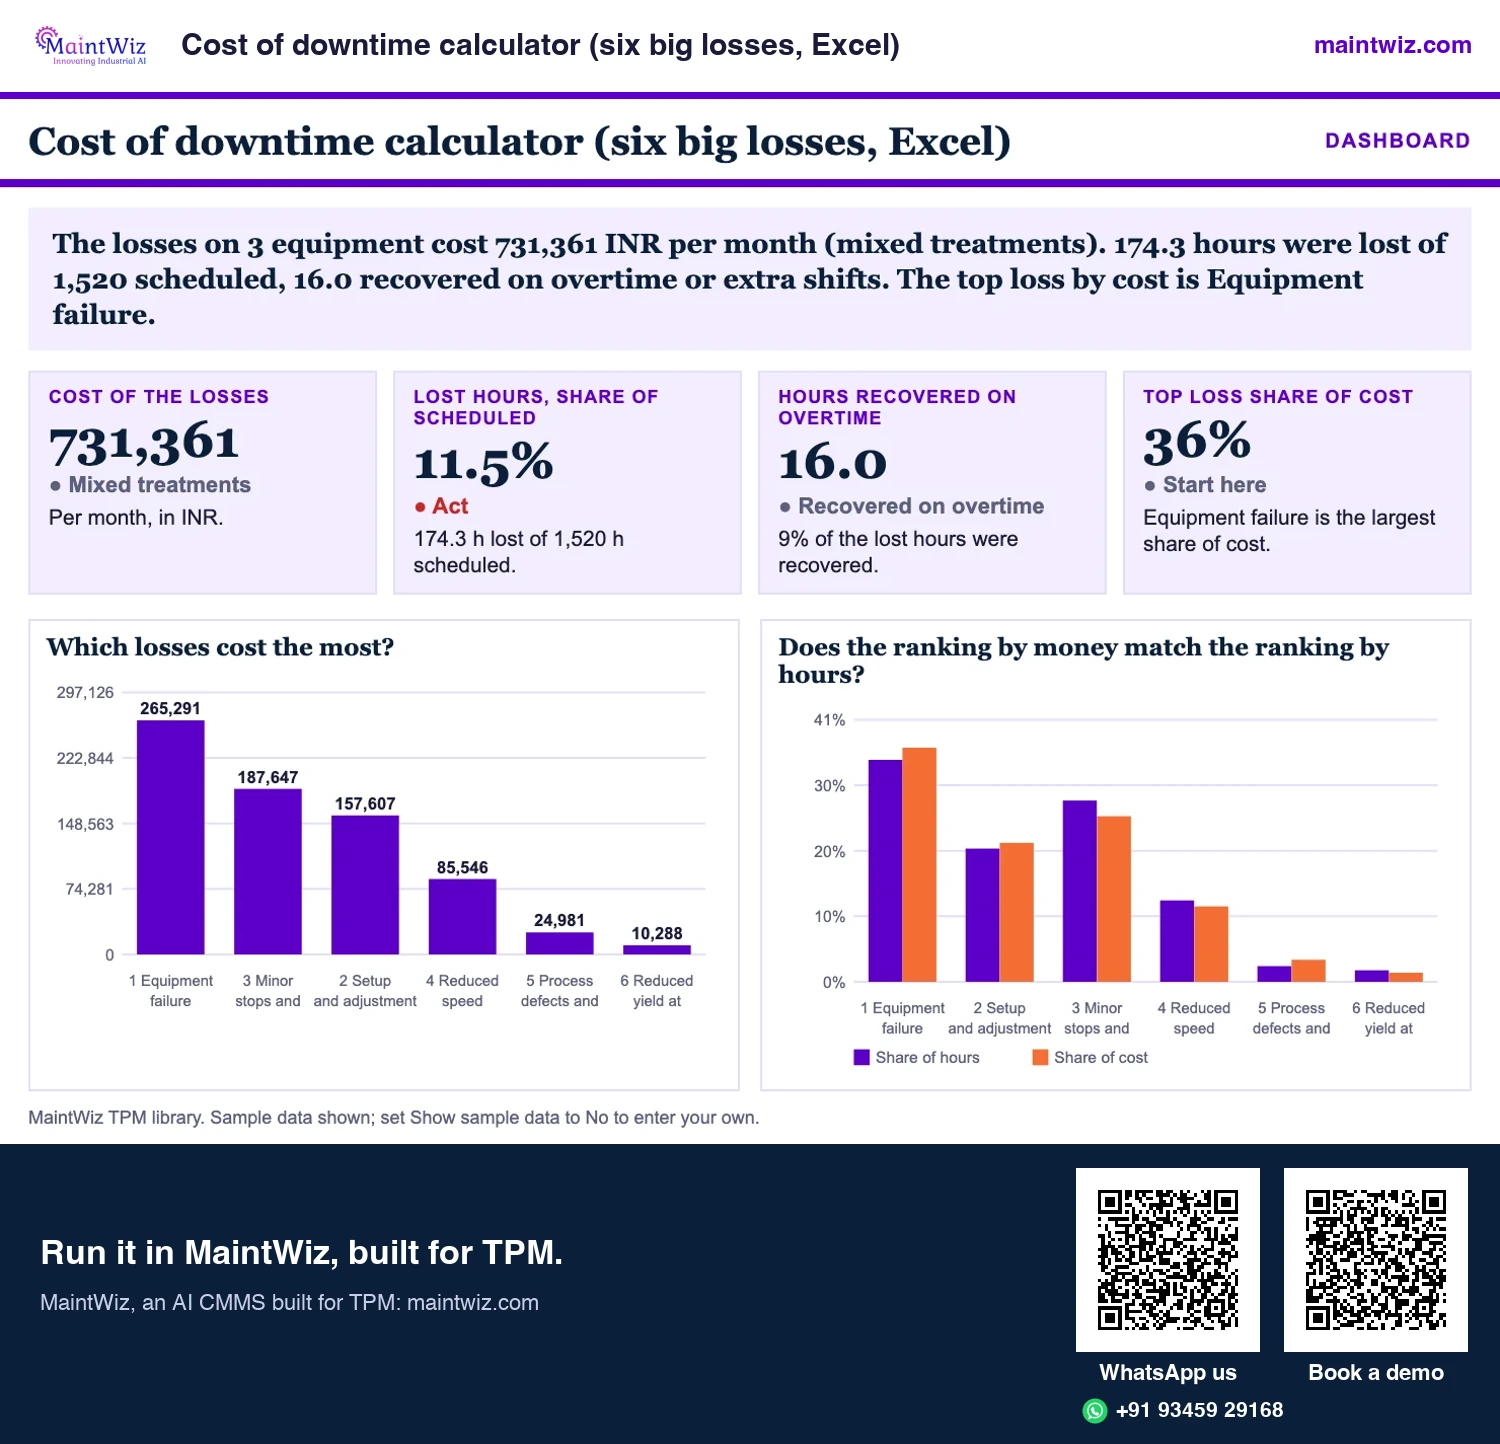
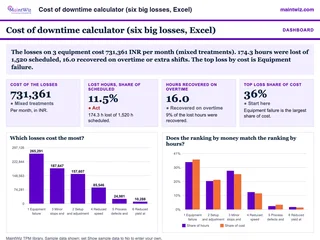 ExcelCost of downtime calculator (six big losses, Excel)
Turn hours lost to each of the six big losses into cost per line, with overtime recovery
- Sheets
- Dashboard, Inputs, Equipment, Results, Read me
- A4
- Version
- v1.2, 5 November 2026
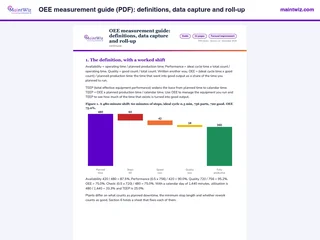 PDFOEE measurement guide (PDF): definitions, data capture and roll-up
Agree one OEE definition, choose a data capture route and roll results up from equipment to plant
- Pages
- 11
- A4
- Created
- 5 November 2026
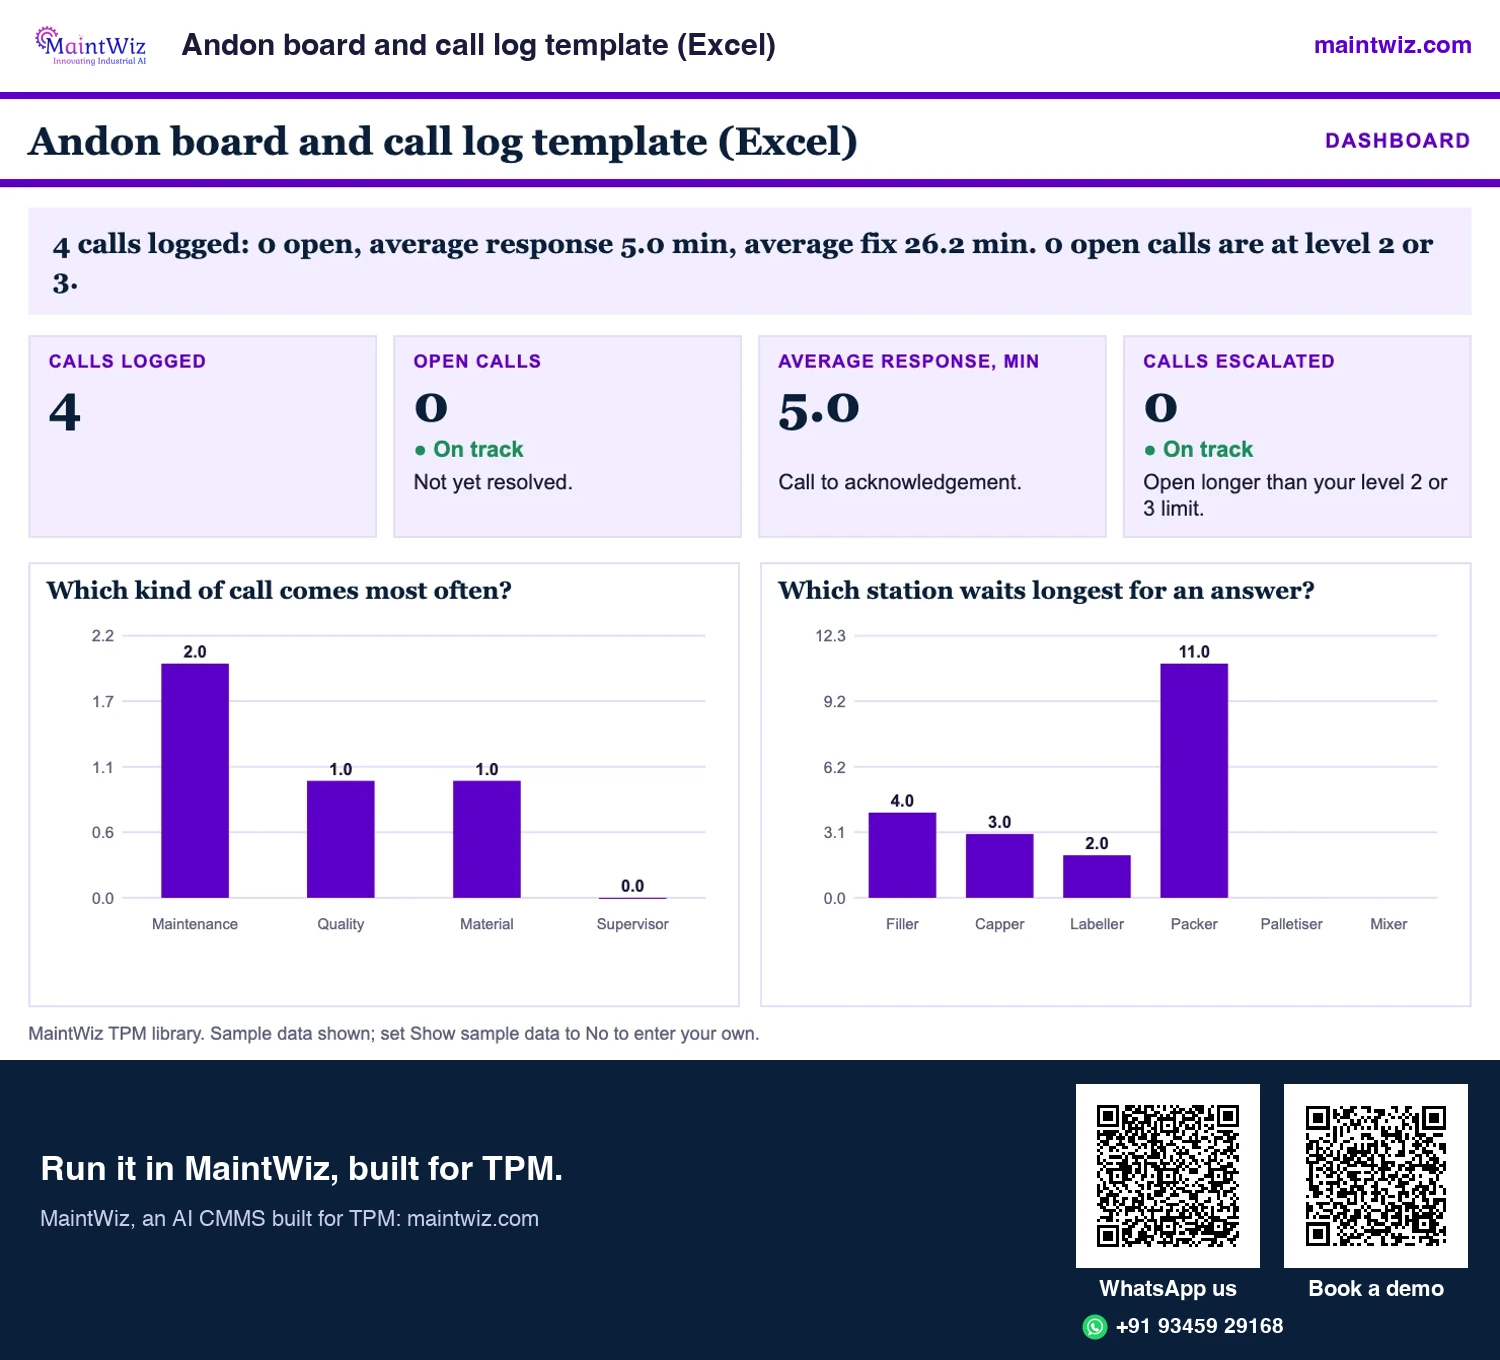
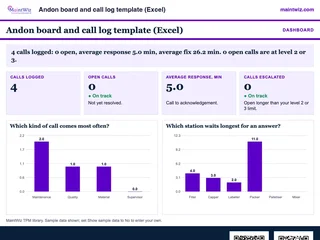 ExcelAndon board and call log template (Excel)
Run an andon line-stop call light with escalation at 10 and 20 minutes, response and fix times
- Sheets
- Dashboard, Inputs, Reason codes, Calls, Board, Board (2 x A4), Results, Read me
- A4
- Version
- v1.1, 5 November 2026
Records captured
Which records does MaintWiz OEE capture?
A reliable OEE figure rests on four kinds of data: the planned production time, every stop with a reason, the counts of total and good output, and the ideal cycle time for each product on each equipment. A system has to capture them at the time they happen, keep the definitions fixed, and make the loss behind the number visible. MaintWiz holds ideal rates in its capacity master, so every OEE figure traces back to its records.
| Data | Why it matters | Common weakness |
|---|---|---|
| Planned production time | Sets the base for availability | Planned stops counted inconsistently between shifts |
| Stops with reasons | Shows what to fix, not only how much was lost | Free-text reasons that cannot be grouped |
| Total and good counts | Give performance and quality | Rework counted as good; counts keyed late |
| Ideal cycle time | Sets the performance benchmark | An average speed used instead of the ideal rate |
Operators enter stops and counts on a mobile device or terminal; MaintWiz can connect IoT, MES, SCADA, PLC and DCS sources. The OEE calculator shows the arithmetic, and the free white paper Measuring OEE from equipment to plant discusses manual, automatic and hybrid capture.
Write down your own definitions of planned time, stops and rework before you compare figures: one written definition applied to every equipment keeps OEE comparable across lines and plants.
Production entry and loss codes
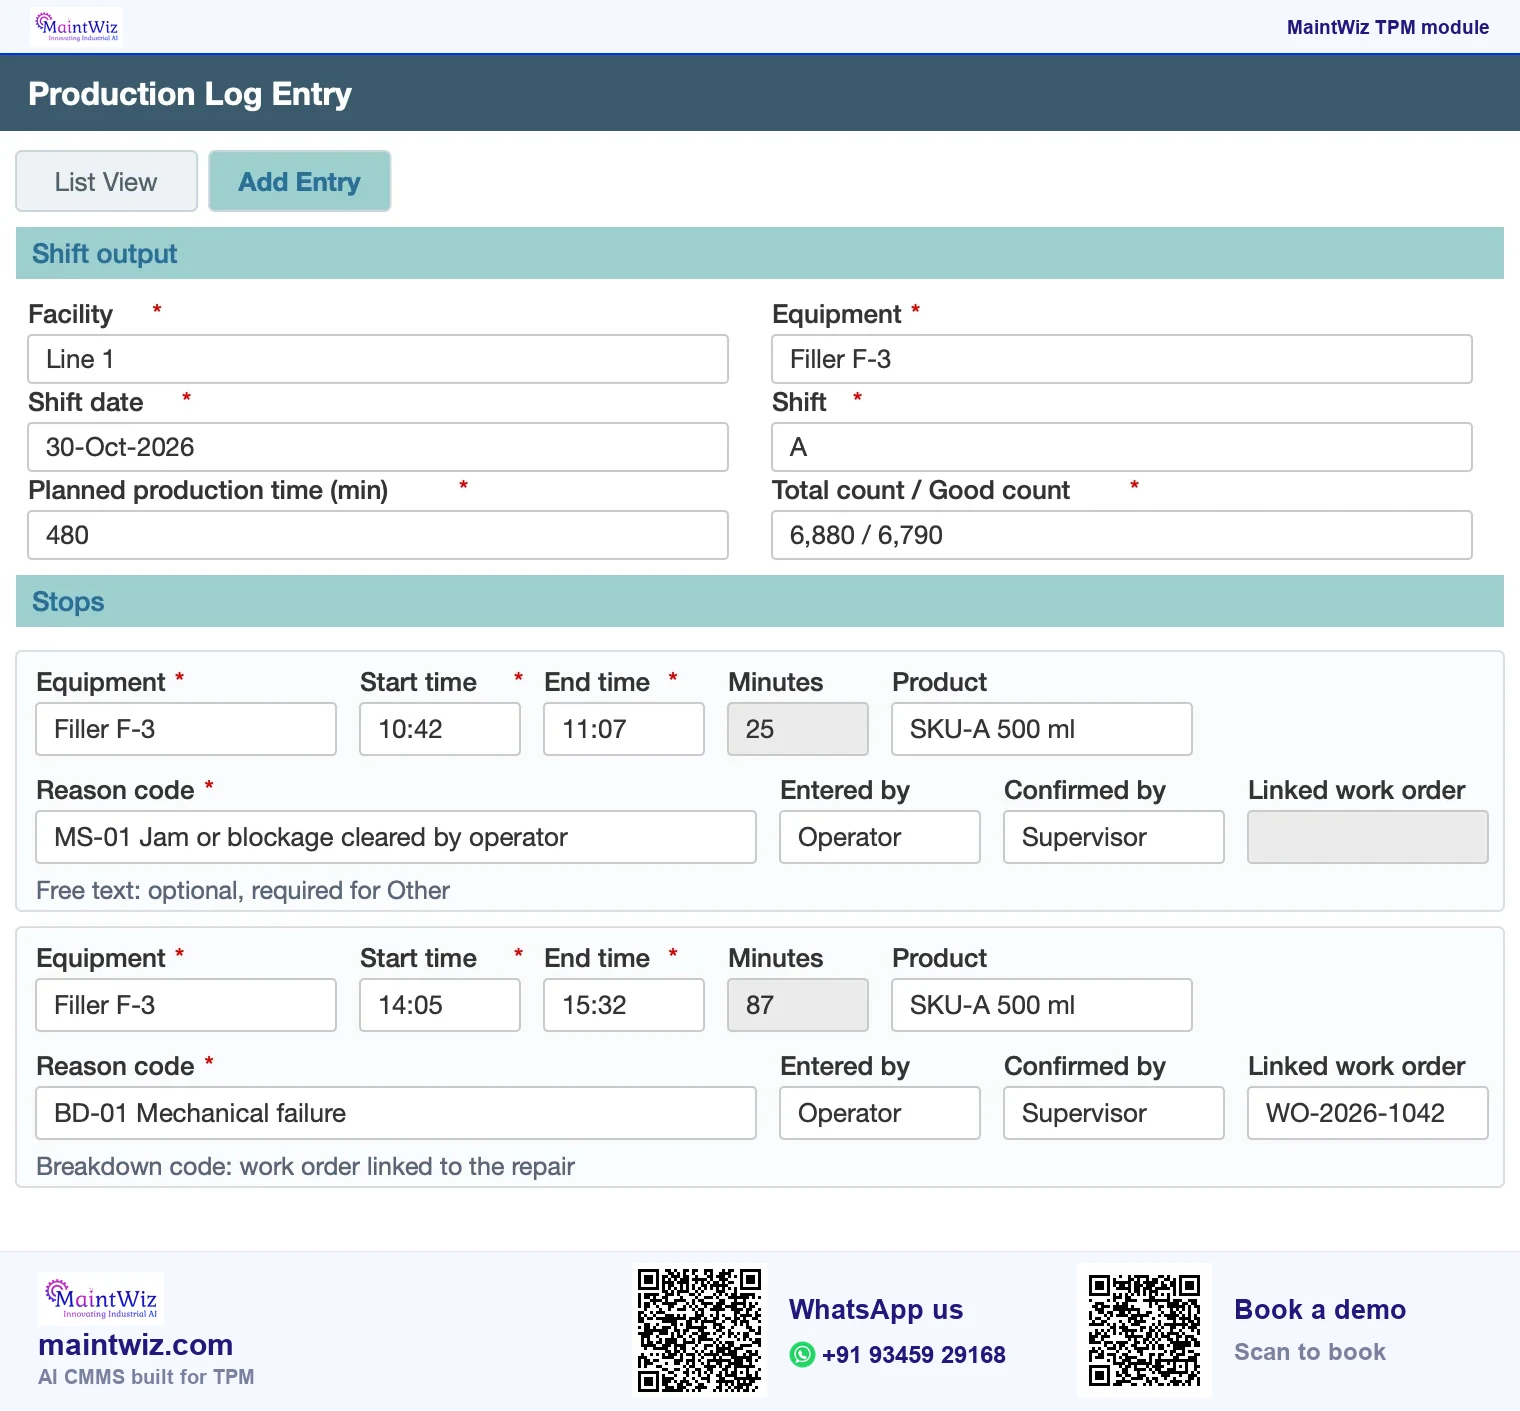
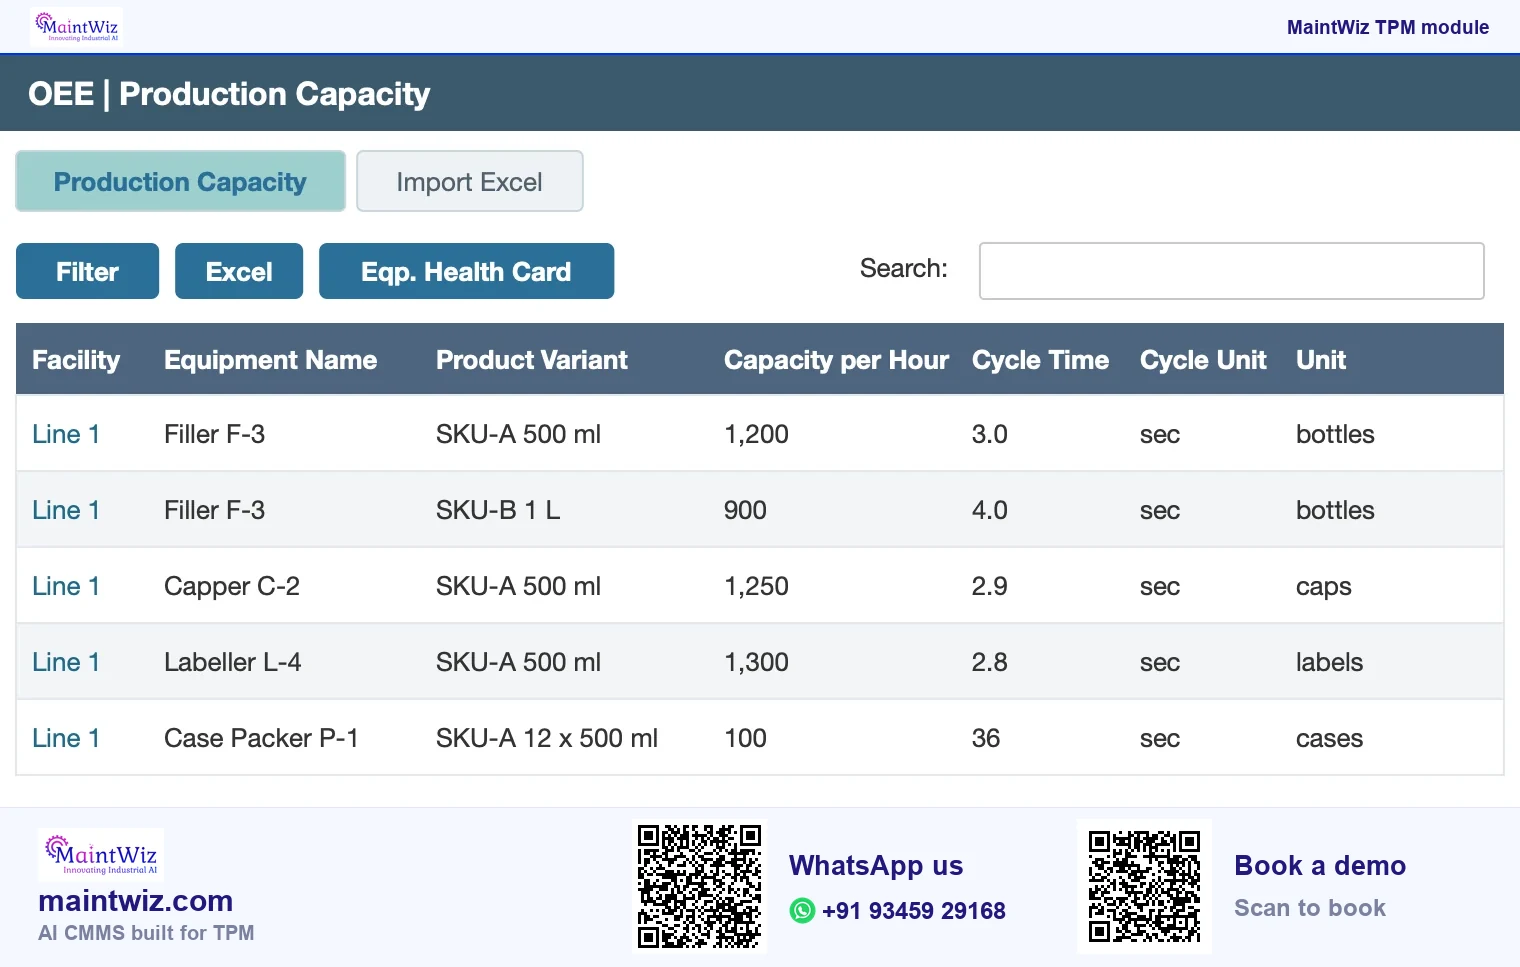
In MaintWiz the Kobetsu Kaizen module holds product variants, capacities, loss codes, production log entry, bulk entry, a loss cost master and a Kobetsu Kaizen report. Loss codes and capacities are set up per plant, so what an operator picks from matches your own loss structure (Figure 1). Start from the free 38-code downtime reason code library, mapped to the six big losses, and load it into the MaintWiz loss master once per equipment with an Excel upload.
Dashboard
How does the MaintWiz OEE dashboard show where the time went?
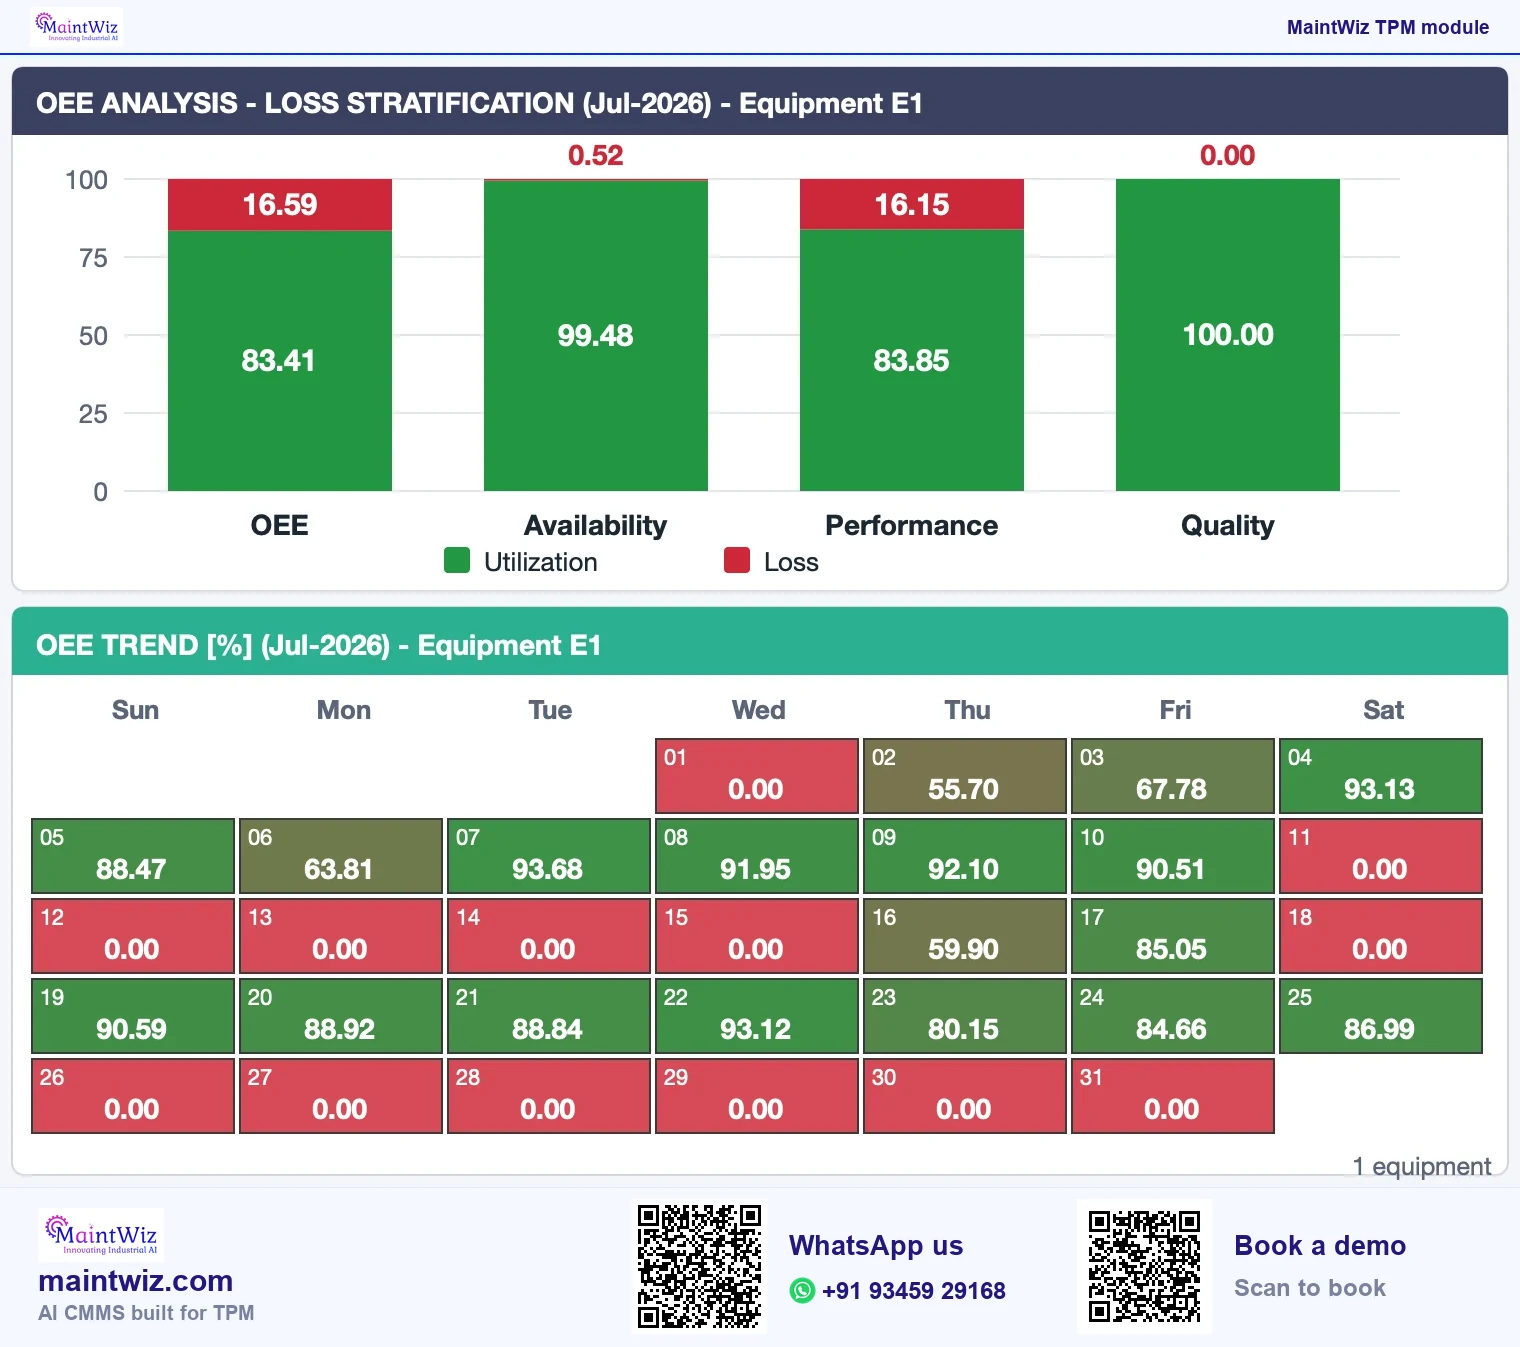
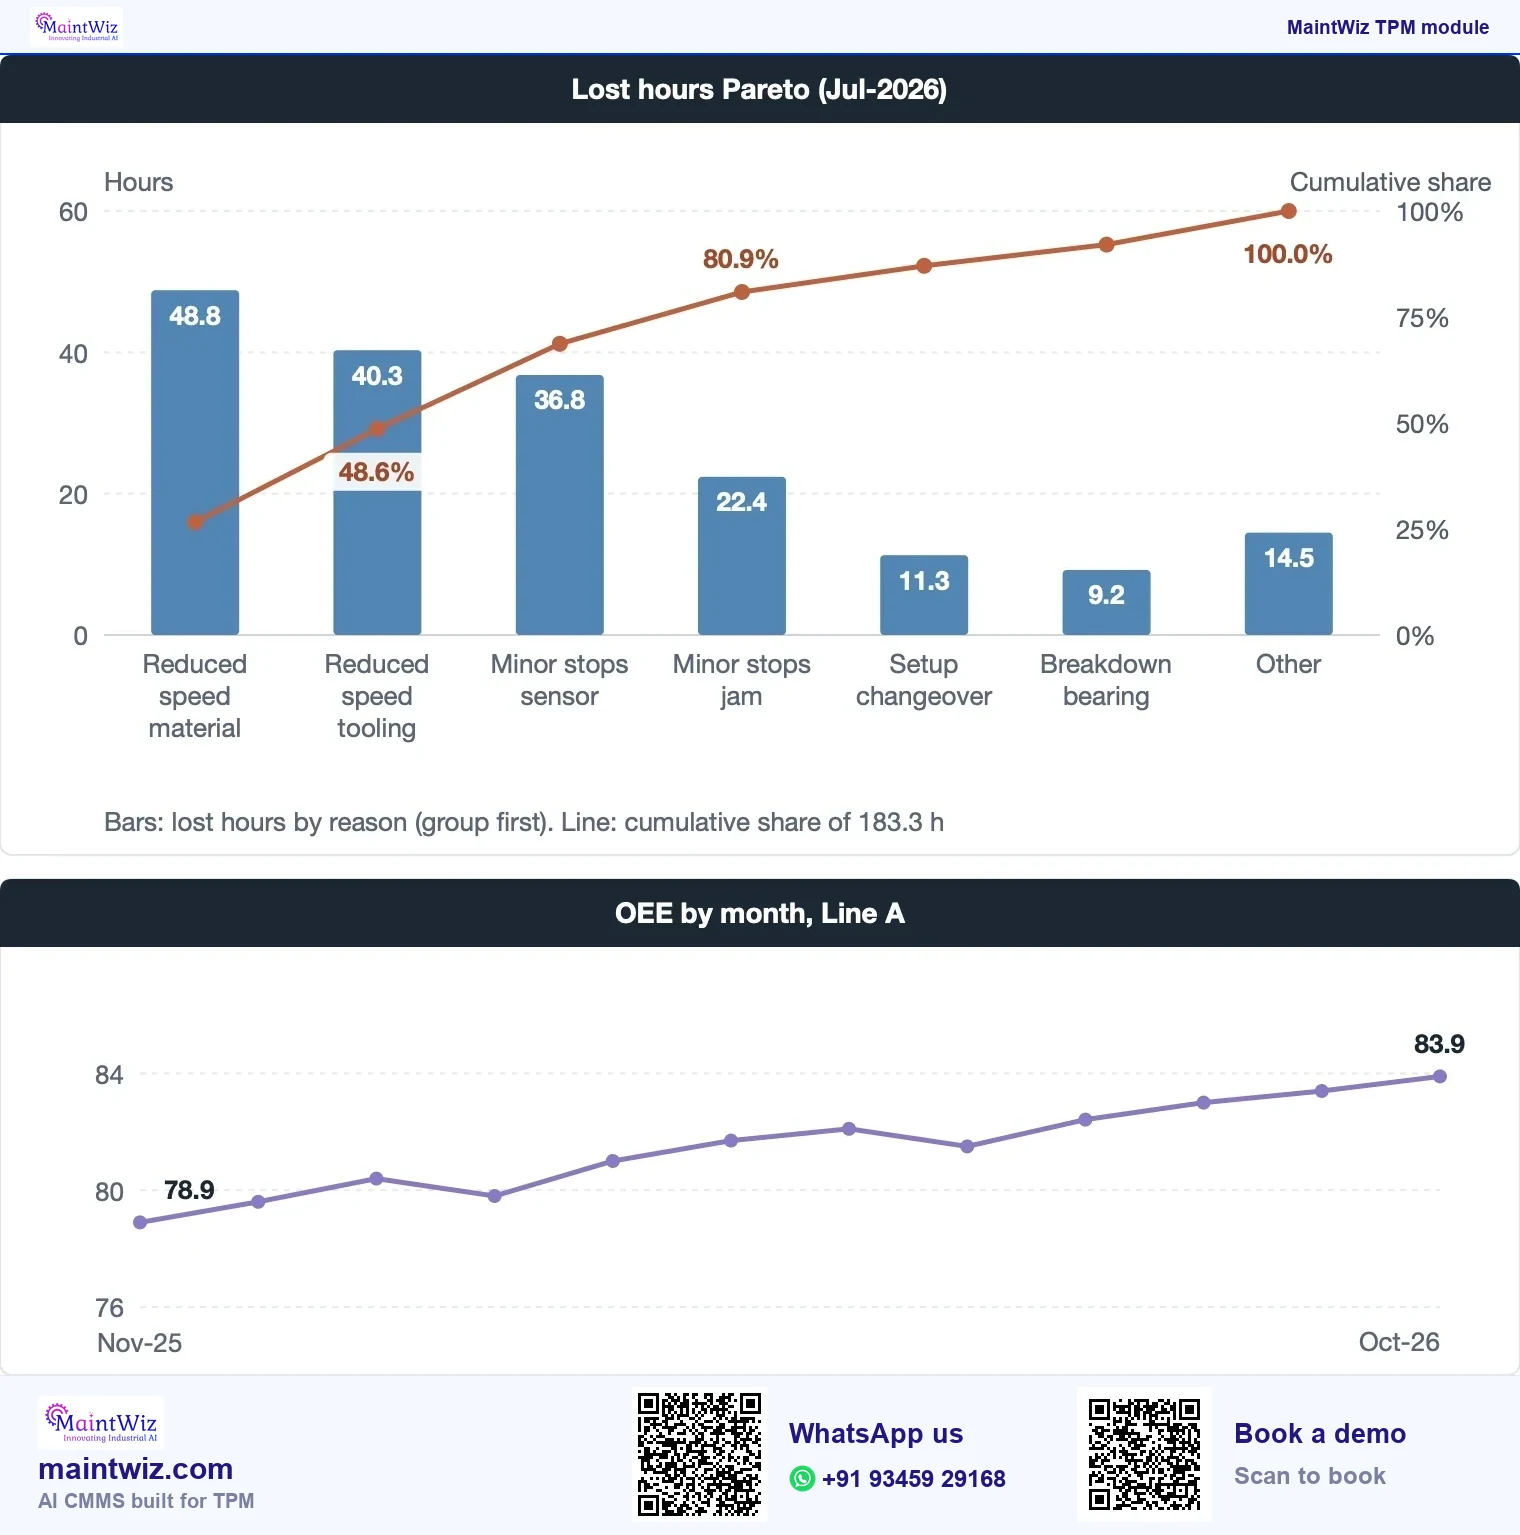
For a chosen equipment and period the dashboard shows OEE with its availability, performance and quality factors as utilisation against loss, and a calendar of daily OEE where holidays and non-running days are visible (Figure 3).
How is OEE rolled up to line and plant?
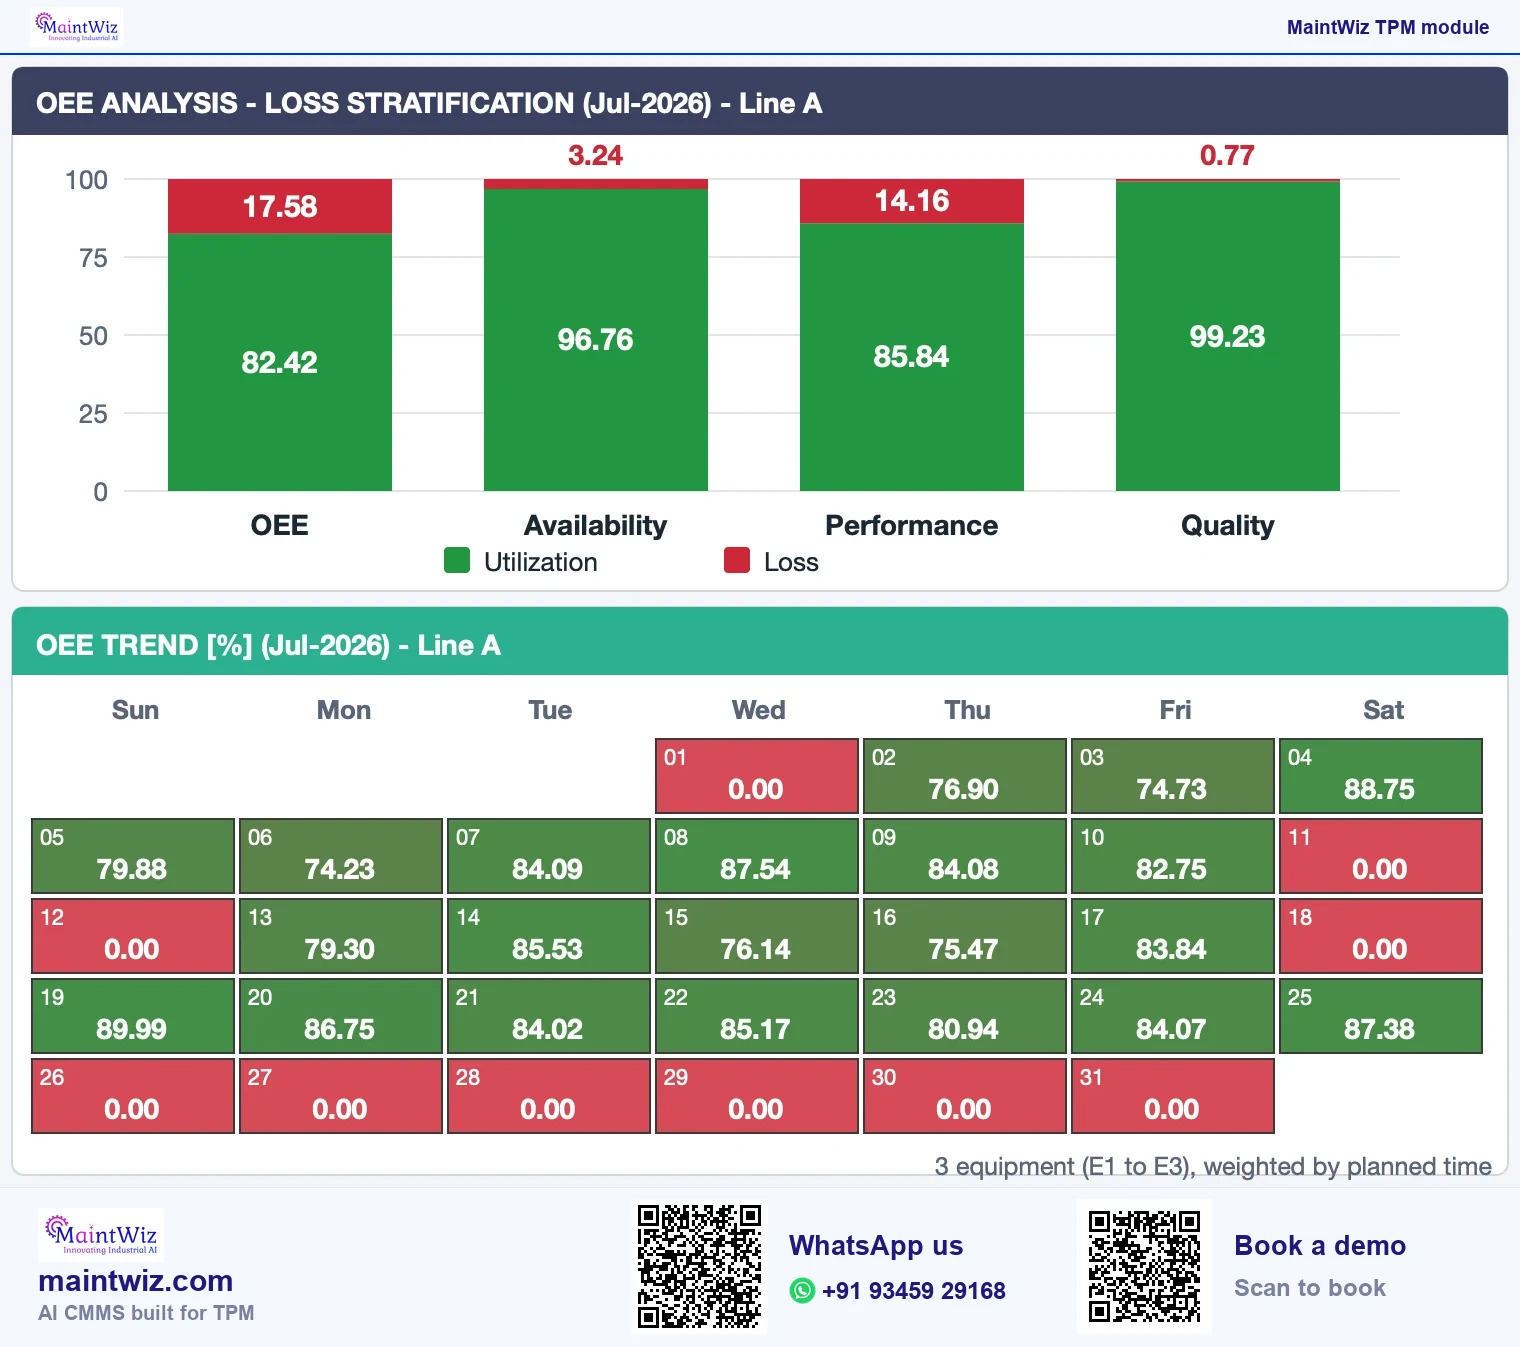
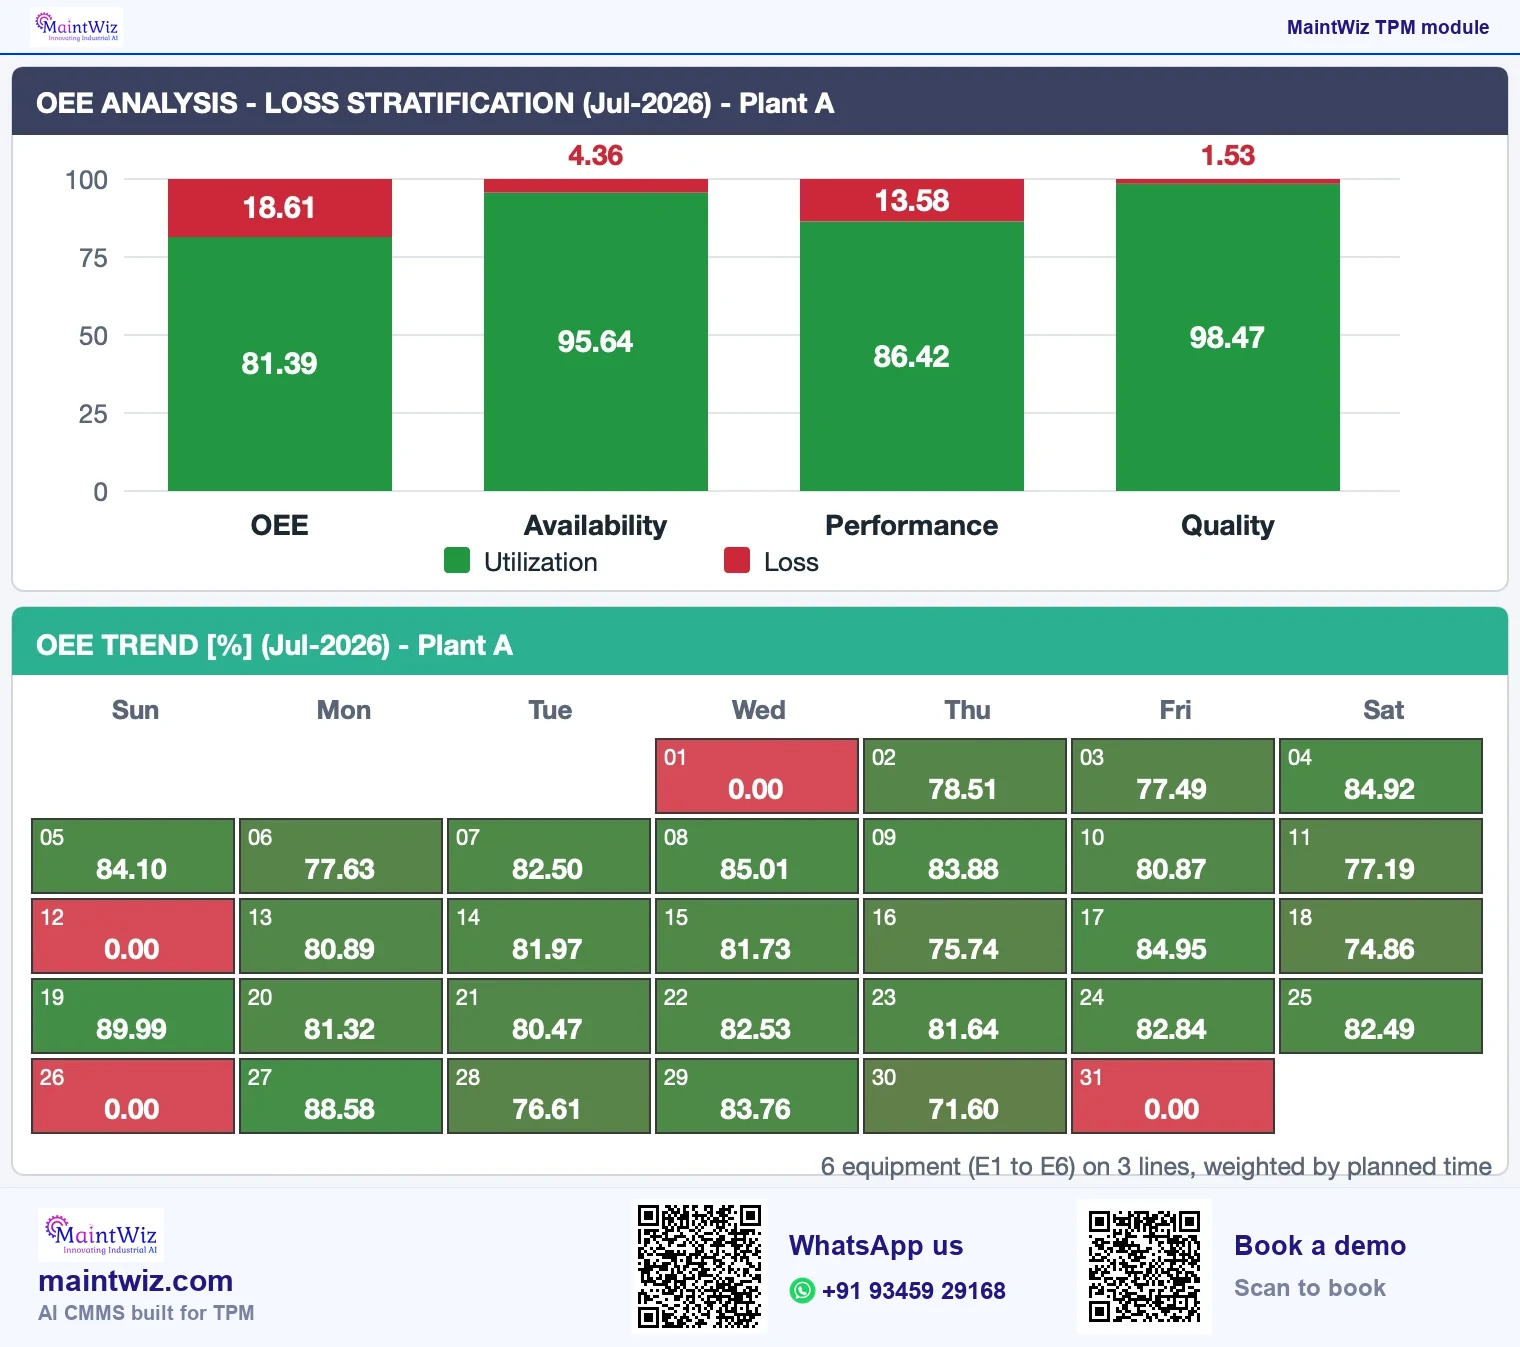
OEE is reported at equipment, line and plant level. The roll-up adds planned time and the ideal time of good output across the equipment in scope and divides once; it does not average percentages. The line and plant views use the same layout as the equipment view (Figure 5).
| Equipment or level | Line | Planned production time (h) | Ideal time of good output (h) | OEE |
|---|---|---|---|---|
| E1 (the equipment shown above) | Line A | 360.0 | 300.29 | 83.41% |
| E2 | Line A | 418.0 | 350.69 | 83.90% |
| E3 | Line A | 304.0 | 240.80 | 79.21% |
| E4 | Line B | 528.0 | 443.47 | 83.99% |
| E5 | Line B | 460.0 | 351.20 | 76.35% |
| E6 | Line C | 450.0 | 364.49 | 81.00% |
| Line A (E1 to E3) | - | 1,082.0 | 891.78 | 82.42% |
| Line B (E4, E5) | - | 988.0 | 794.67 | 80.43% |
| Line C (E6) | - | 450.0 | 364.49 | 81.00% |
| Plant A (E1 to E6) | - | 2,520.0 | 2,050.94 | 81.39% |
The line and plant views are built from the equipment in the table. Line A is equipment E1 to E3: (300.29 + 350.69 + 240.80) / (360.0 + 418.0 + 304.0) = 891.78 / 1,082.0 = 82.42%. A simple average of the three equipment OEEs would give 82.17%, which is not the line's OEE, because the equipment ran for different planned times. Line and plant OEE roll up from equipment by planned time, and the line and plant views can be configured to show the equipment in scope.
Losses to action
How do you turn OEE losses into action?
The reason to track losses is to act on the biggest one. The lost-hours Pareto points at the loss category to attack first, and the pillar that owns it follows: breakdown losses go to planned maintenance and Jishu Hozen, chronic losses to Kobetsu Kaizen, defect losses to quality maintenance. Taking the losses one at a time, largest first, is how plants improve OEE with TPM. MaintWiz ranks lost hours on the Pareto for each equipment, line and plant, so the first project is chosen from the data.
Setting up OEE tracking: a first month
| Week | Do | Output |
|---|---|---|
| 1 | Agree the OEE definition, planned-time rule, minimum stop length and reason codes | Written metric definitions |
| 2 | Set the ideal cycle time for each product on the pilot equipment | Ideal rate table with owner |
| 3 | Start capturing production, stops and counts for the pilot lines | Daily data with reasons |
| 4 | Review the first Pareto of lost time; pick the first loss project | Project list from loss data |
A metric dictionary helps keep the definitions in one place.
Master data to prepare before you start
| Master data | Why it matters | Who owns it |
|---|---|---|
| Equipment hierarchy (plant, line, equipment) | OEE rolls up along the hierarchy | Maintenance or engineering |
| Products and ideal cycle times | Performance depends on the ideal rate per product | Process engineering |
| Loss codes mapped to the six big losses | Roll-up and Pareto depend on consistent codes | TPM lead with production |
| Planned time rules (shifts, breaks, planned stops) | Availability depends on the base | Production |
| Counts source and rework rule | Quality depends on good first time counting | Quality |
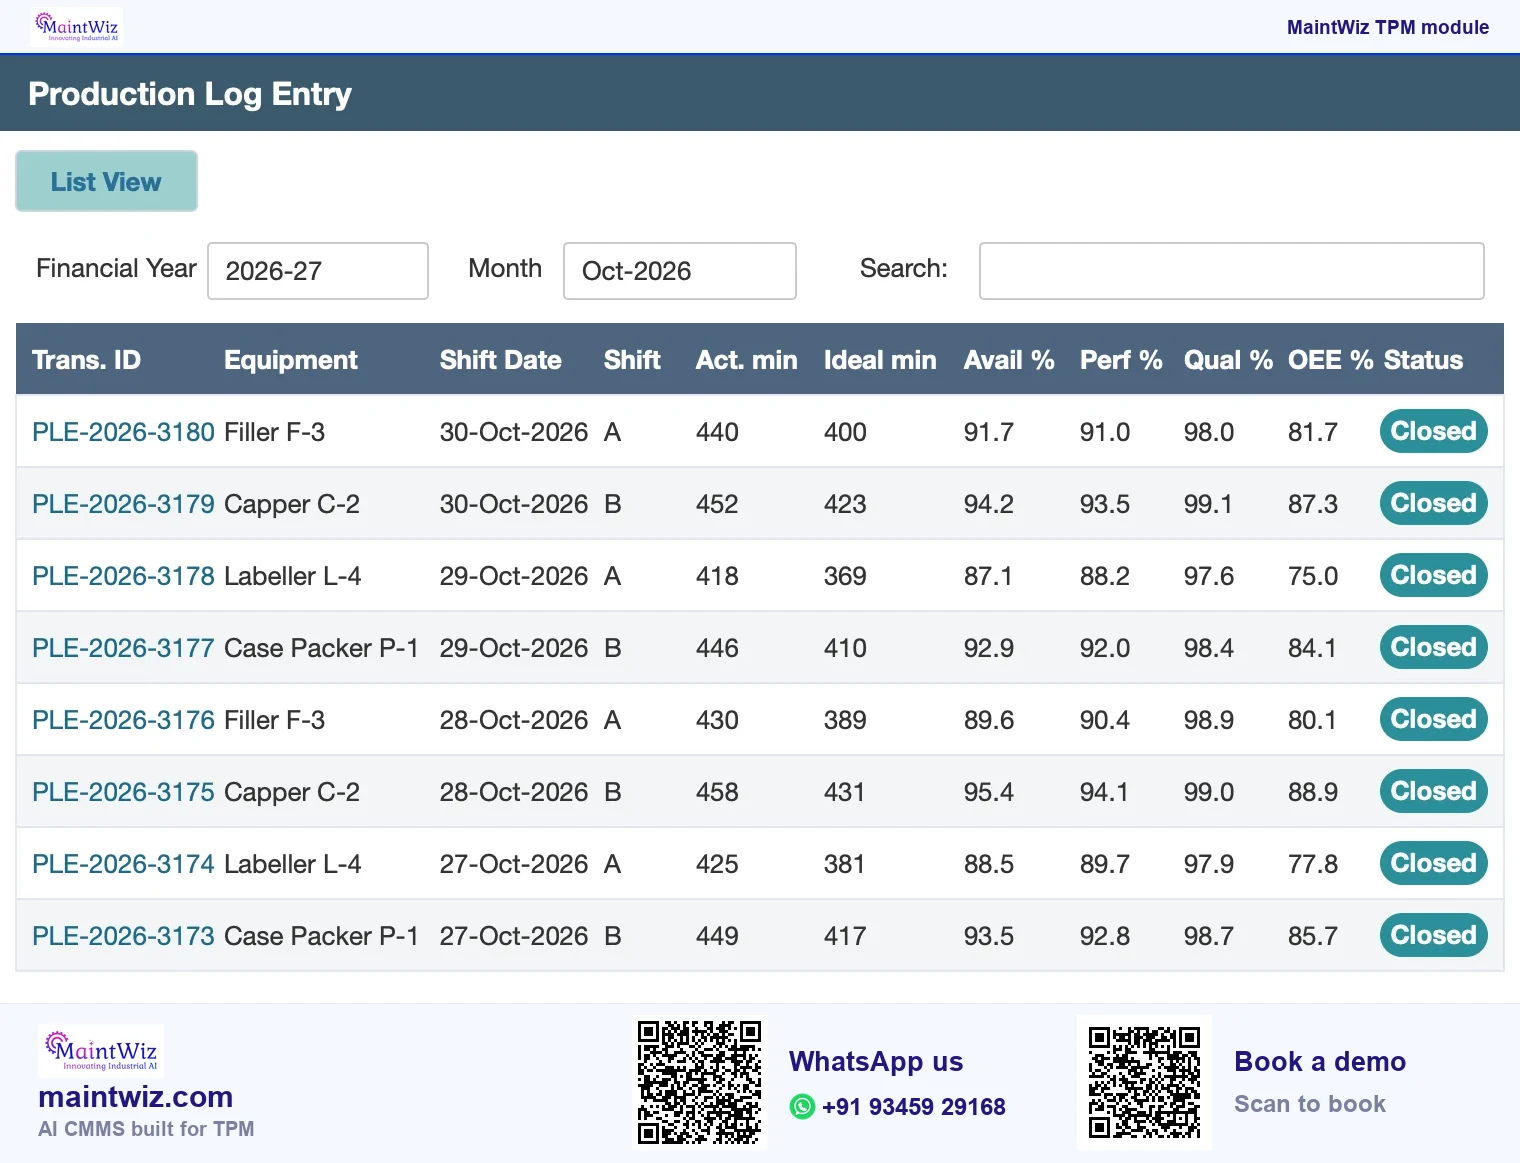
With the OEE definitions agreed and checked in the OEE calculator, each shift's OEE is computed from its production log (Figure 2: the production log by shift).
What to test
What to test in an OEE demo
Run these checks on your own equipment, stop reasons and ideal rates in a MaintWiz demo.
- Enter a stop and its reason on a real equipment; see how many steps it takes.
- Change the ideal rate for a product and see the effect on performance.
- Reproduce a worked example from your own numbers and check the answer by hand.
- Roll up three equipment to a line and check the weighting: it must add times, not average percentages.
- Export the data and the definitions in use.
- Ask what happens to a factor above 100%.
Downtime report: planned, unplanned and performance loss
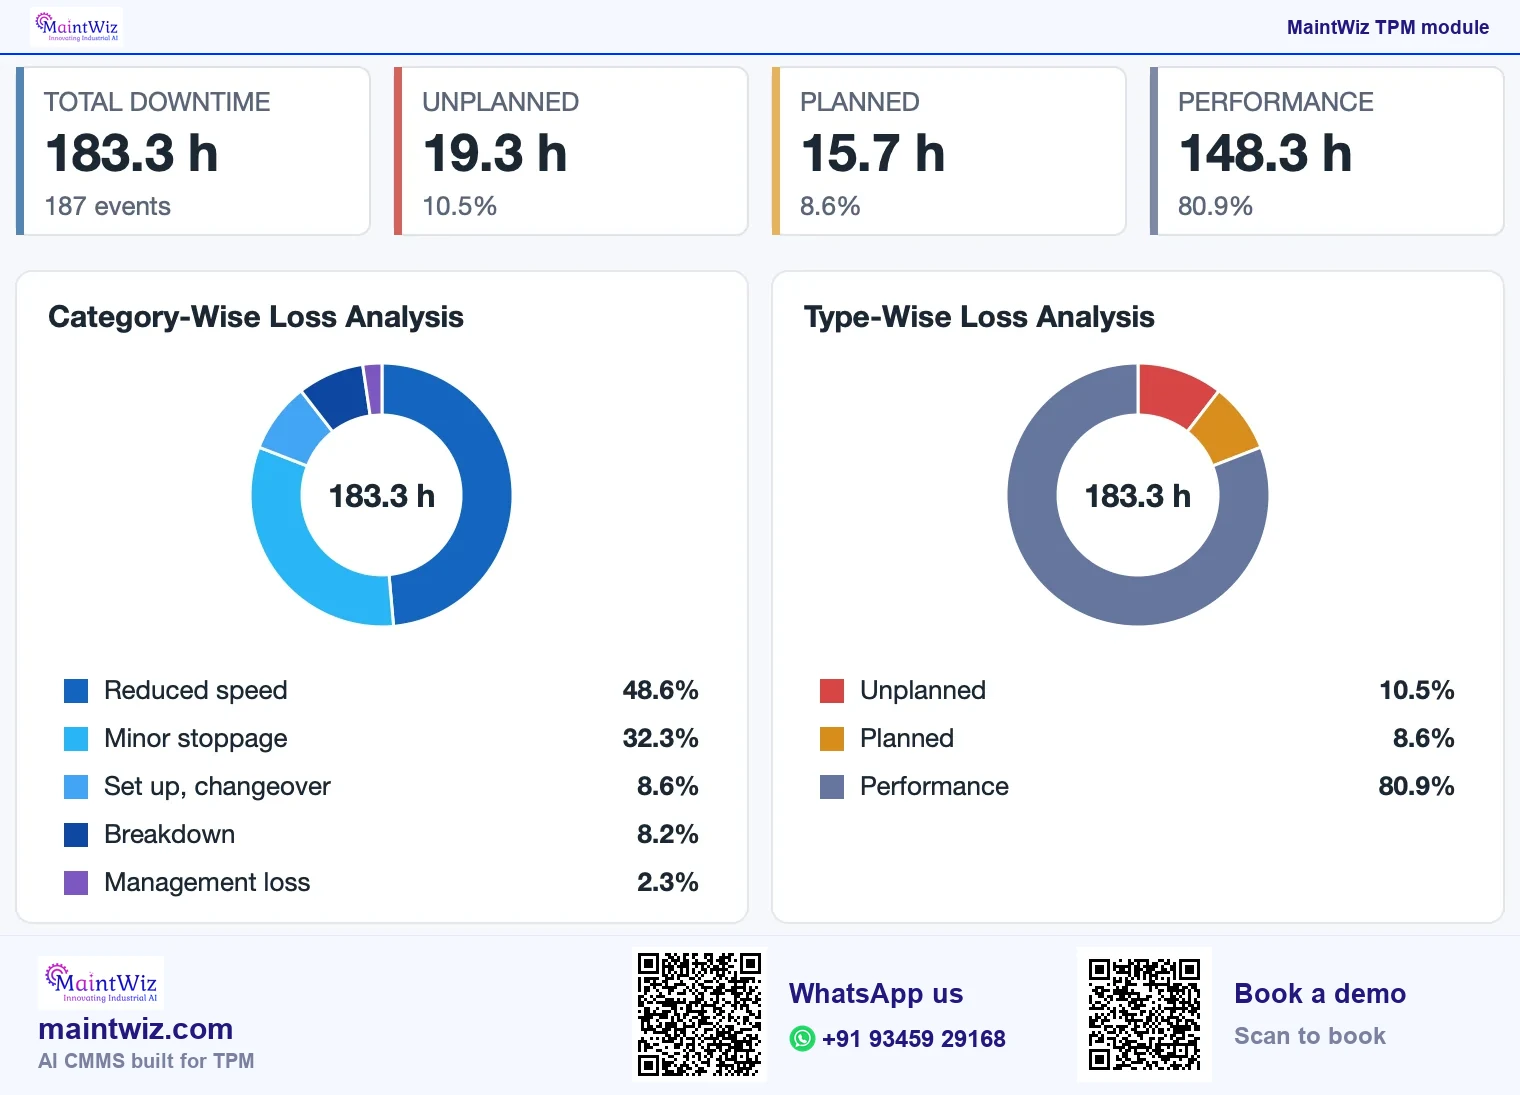
The downtime report summarises total downtime and its events, splits it into unplanned, planned and performance loss, and shows category-wise and type-wise breakdowns with a lost-hours Pareto. A list view holds the events behind the summary. It reads from the same stop records as the OEE views, so one reason code feeds both (Figure 8).
Setting up OEE
How do you set up OEE so the numbers hold?
Agree the ideal rate, stop reasons and planned time once for each equipment, and every stop and count then runs on the same definitions through OEE, the lost-hours Pareto and the downtime report. Operators raise a stop on a mobile device or terminal, and the same record shows in the equipment view, the Pareto and the downtime report.
Machine data, deployment and export
Counts and stops can come from operator entry or from connected sources: MaintWiz can connect IoT, MES, SCADA, PLC and DCS data, and integrates with SAP through the PM and MM modules using web services; live enterprise implementations exist. Operators can capture records on mobile devices as well as at a terminal.
Line and plant views can be configured to show the respective roll-ups of the equipment in scope. Data can be exported to XLS and PDF. MaintWiz is delivered as public software as a service; on-premises deployment is available on request. MaintWiz TPM software pricing is quoted for the modules and users you need. MaintWiz AI agents run on your records and propose a list of what needs to be watched; your team approves what is acted on.
MaintWiz calculates OEE as availability × performance × quality; ISO 22400-2:2014 defines the OEE index as availability × effectiveness × quality ratio.
FAQ
Frequently asked questions
Does MaintWiz calculate OEE inside the CMMS?
Yes. MaintWiz, an AI CMMS built for TPM, calculates OEE as a module on the same equipment list as work orders, and rolls it up to line and plant by planned time, adding times rather than averaging percentages.
How is OEE rolled up to line and plant?
OEE is rolled up by adding planned time and the ideal time of good output across the equipment in scope and dividing once, not by averaging percentages. The line and plant views use the same layout as the equipment view.
Does MaintWiz show OEE by line and plant?
Yes. OEE is reported at equipment level, and line and plant views can be configured to show the respective roll-ups of the equipment in scope, weighted by planned time rather than averaged.
What should I check when buying OEE software?
Check that it runs on the same equipment list as maintenance and the TPM pillars, so a loss and the work that removes it are read together. MaintWiz holds OEE, the lost-hours Pareto, the downtime report and a dashboard for each of the eight pillars, and exports to XLS and PDF.
What master data does MaintWiz OEE need?
An equipment hierarchy, products with ideal cycle times, loss codes mapped to the six big losses, planned time rules and a rule for counting good output and rework.
What should I test in an OEE demo?
Enter a stop on a real equipment, change an ideal rate, reproduce a worked example by hand, roll up equipment to a line and check the weighting, and ask for a data export.
How much does OEE software cost?
MaintWiz OEE software is quoted for the modules and users you need, so the quote follows the equipment, lines and plants in scope. Ask for a quote with a demo and bring your equipment list; the same quote can cover the TPM pillar modules.
Does MaintWiz OEE software integrate with SAP?
Yes. MaintWiz integrates with SAP through the PM and MM modules using web services, and live enterprise implementations exist. Operators enter stops and counts on a mobile device or terminal; MaintWiz can connect IoT, MES, SCADA, PLC and DCS sources, so OEE runs on the same equipment records as maintenance.
Sources
Sources
- ISO 22400-2:2014, Automation systems and integration: Key performance indicators (KPIs) for manufacturing operations management, Part 2: Definitions and descriptions https://www.iso.org/standard/54497.html