
Key takeaways
- Preventive maintenance moves stops into agreed windows, so production plans around them instead of reacting to them.
- Fewer emergency jobs keep technicians on planned work, which cuts overtime and repeat delays.
- Dated jobs let stores reserve parts and planners balance labor by craft weeks ahead.
- Five numbers prove the effect: planned work share, emergency rate, unplanned downtime, PM compliance and window adherence.
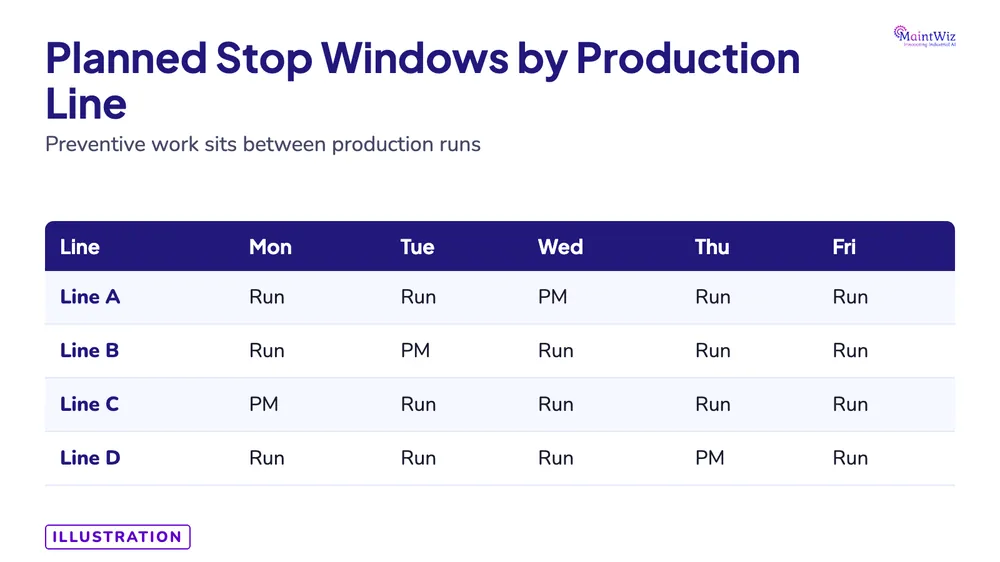
Preventive maintenance streamlines plant operations by turning surprise failures into planned work: jobs are scheduled into agreed stop windows, parts and people are ready, and production knows what is coming. The result is steadier output, fewer emergency jobs and a maintenance workload you can forecast. You can prove it with five numbers, shown below.
How does preventive maintenance stabilize plant operations?
A plant runs smoothly when the next eight hours look like the last eight. Breakdowns break that rhythm: the line stops without warning, the best technician drops a planned job, someone hunts for a part, and production rebuilds its schedule around the gap. Preventive maintenance (PM) removes much of that noise by deciding in advance when each asset is touched and what that takes.
This page is about the operating effect of PM: what changes on the shop floor, and how to measure it. For the definition and the types of PM see what is preventive maintenance, and for building the full plan see preventive maintenance programmes.
What exactly gets smoother on the plant floor?
Four things change, and each one can be traced to a decision PM forces you to make early.
| Operating area | Without PM (reactive) | With PM (planned) | Number to watch |
|---|---|---|---|
| Downtime | Stops arrive at random, mid-shift, often at peak load | Stops happen in agreed windows, with a known duration | Unplanned downtime hours; planned stop adherence |
| Maintenance workload | Emergency jobs interrupt planned ones; overtime spikes | Work is spread across the week and the month | Planned work share; emergency work orders |
| Spares | Rush purchases, air freight, parts borrowed from other machines | Parts are reserved against the scheduled job | Jobs delayed waiting for parts; expedited orders |
| Production coordination | Operations hears about the stop when the line trips | Operations signs off the window days ahead | PM window conflicts; jobs cancelled by production |
How do planned downtime windows work?
The most direct way PM streamlines operations is by moving stops to a time you choose. A bearing change that takes four hours on a Sunday night costs little. The same change on a Tuesday at 2 pm, after the bearing seizes, costs the four hours plus the secondary damage, the scrap, the restart and the scramble.
To make windows work:
- Agree the window with production first. Fixed weekly or monthly slots per line or area, owned jointly by maintenance and operations.
- Bundle tasks per asset. When a machine is stopped, do every due task on it (lubrication, inspection, part change) in one visit. Fewer stops, same coverage.
- Set the job length from history. Use actual completion times from past work orders, not the estimate on the template.
- Protect the window. A window that production can cancel every time orders are tight stops being a window within two months.
For how to sequence tasks and intervals inside those windows, see optimizing preventive maintenance scheduling.
Why do emergency jobs fall when PM works?
Emergency work is what is left when nothing was caught early. Every PM task that finds a loose belt, a leaking seal or a worn chain before it fails converts a future emergency into a routine job. Two side effects matter to operations:
- Technicians are not pulled off planned work. This is the quiet multiplier: one emergency delays several planned jobs, which then become the next emergencies.
- Overtime and call-outs fall. Planned jobs are done in normal shifts, with the right permits and tools prepared.
The effect only shows if PM tasks are worth doing. A PM that never finds anything is either on the wrong asset or at the wrong interval; review it rather than keep it for comfort. The Planned Maintenance pillar in Total Productive Maintenance covers how that review fits the wider improvement cycle.
How does PM improve spares and labor planning?
Once a job has a date, its needs can be planned. That is a bigger operating gain than it sounds, because most of the delay in a repair is waiting, not wrenching.
- Parts: when each PM task lists its parts, the stores team can reserve them before the window and reorder consumables from the schedule instead of from a crisis. See spare parts management for how stock links to scheduled work.
- Labor: the schedule shows next month's hours by craft, so you can see a shortage of electricians in week 3 while there is still time to move a job or arrange cover.
- Permits and isolations: routine jobs can have their safety steps prepared once and reused, which shortens the start of the window.
- Contractors: specialist visits (for example calibration or a crane inspection) can be booked weeks ahead rather than at premium urgency.
How do you measure whether PM is stabilizing operations?
Do not rely on "it feels calmer". Pick five measures, take a baseline for the last three to six months, and review monthly. Use the same definitions every month.
| Measure | Formula | Direction that shows stability |
|---|---|---|
| Planned work share | Planned work order hours divided by total work order hours | Up |
| Emergency work order rate | Emergency work orders divided by operating hours (per 1,000 hours) | Down |
| Unplanned downtime | Hours lost to unplanned stops in the period | Down |
| PM compliance | PM work orders completed on time divided by PM work orders due | Up, and holding |
| Window adherence | Planned stops that started and ended within the agreed window divided by planned stops | Up |
Read them together. PM compliance rising while unplanned downtime stays flat suggests the tasks are being done but are the wrong ones, though allow a few months for the effect to show. Planned work share rising while window adherence falls suggests jobs are overrunning and need better time estimates.
Worked example (illustration)
The numbers below are an illustration, not customer data. A line ran 600 operating hours a month before a PM push and 600 after.
| Measure | Before | After |
|---|---|---|
| Emergency work orders | 12 | 6 |
| Emergency rate per 1,000 operating hours | 20 | 10 |
| Unplanned downtime (hours) | 30 | 14 |
| Planned work share (by hours) | 45% | 65% |
| PM compliance | 70% | 92% |
Emergency rate is 12 divided by 600 times 1,000, which is 20; after, 6 divided by 600 times 1,000, which is 10. Planned stop hours would typically rise a little, since PM moves downtime into windows rather than deleting all of it. The point is that total stopped time and its unpredictability both fall.
How does an AI-powered CMMS support this?
MaintWiz is an AI-powered CMMS built for Total Productive Maintenance. It supports the stabilizing loop above as follows:
- PM schedules generate work orders with checklists on their due dates, so planned work does not depend on someone remembering it.
- Spare parts are linked to maintenance schedules, so critical spares are available when the job comes due.
- PM dashboards and PM compliance reports show what was done, what is overdue and which tasks are incomplete, and KPIs are configurable to the measures in the table above.
- Readings from IoT, SCADA, PLC and MES systems can be integrated, and a work order can be created automatically when a reading breaches its limit, catching problems between scheduled visits.
- AI proposes, people approve: suggested schedule and priority changes go to your planners for a decision, and the plan stays under their control.
Guided onboarding by our customer success managers, with Excel uploads of your assets and PM tasks, takes you live in 4 to 6 weeks. See maintenance scheduling and preventive maintenance software for the screens.
What should you do first?
- Pull the last three to six months of work orders and compute the five measures above. That is your baseline.
- Pick the one line or area that causes the most unplanned stops and agree a recurring stop window with its production lead.
- Bundle that area's due PM tasks into the window, with parts reserved and the time estimate taken from past jobs.
- Review the five measures after one month, adjust task intervals and the window length, then repeat on the next area.
FAQs
How does preventive maintenance streamline plant operations?
It schedules inspections, lubrication and part changes into agreed stop windows. Stops become predictable, emergency jobs fall, parts and labor are ready, and production plans around known maintenance instead of reacting to breakdowns.
How do you measure the effect of preventive maintenance on operations?
Take a three to six month baseline, then track planned work share, emergency work orders per 1,000 operating hours, unplanned downtime hours, PM compliance and planned-stop window adherence each month. Read them together, not alone.
Does preventive maintenance eliminate downtime?
No. It moves downtime from unplanned to planned stops and reduces its total. Planned stop hours may rise slightly, while unplanned hours and their disruption to production should fall.
Why is PM compliance high but breakdowns still happen?
The tasks are being done but are probably the wrong ones, at the wrong intervals or on the wrong assets. Review failure history, remove tasks that find nothing, and add tasks aimed at the failures that actually occur.
How long does it take to roll out MaintWiz?
Go-live takes 4 to 6 weeks. Customer success managers guide onboarding and load your assets and PM schedules from Excel uploads.